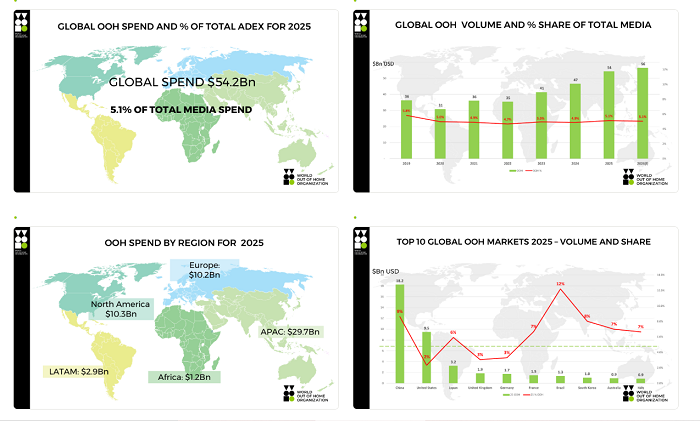
The Global Out of Home (OOH) spend reached US$54.2bn in 2025 up 15% on 2024, confirming OOH’s position as a resilient and growing factor in the media mix, states the World Out of Home Organization in its 2026 Global Out of Home Expenditure Report. This represents 5.1% of global advertising expenditure (ADEX). Spend is forecast to rise further to US$56.4bn USD in 2026.
The 2026 WOO Global Out of Home Expenditure Report captures OOH advertising expenditure globally across 2025 and sets out forecasts for 2026.

Conducted through a detailed questionnaire to WOO members and OOH associations around the world, it remains the most comprehensive measure of OOH expenditure on a global scale. This year’s report drew on over 100 individual responses covering 85 unique territories that together account for 95% of global GDP. It is available to all WOO Members.
Building on a continuous data set running back to 2019, the survey allows the industry to track investment in OOH alongside local economic conditions and the continued expansion of Digital Out of Home (DOOH), which remains the primary engine of growth for the medium.
APAC dominates
Regionally, APAC continues to dominate, accounting for around 55% of global OOH spend at $29.7bn. North America (US$10.3bn) and Europe (US$10.2bn) follow ahead of LATAM (US$2.9bn) and Africa (US$1.2bn).
The top 10 markets volume are led by China (US$18.2bn) and the United States (US$9.5bn), followed by Japan (US$3.2bn), the United Kingdom (US$1.85bn), Germany (US$1.71bn), France (US$1.47bn), Brazil (US$1.33bn), South Korea (US$1.04bn), Australia (US$0.91bn) and Italy (US$0.85bn). Among these, Brazil (+12%), China (+9%) and South Korea (+8%) posted the strongest share of total media.
Digital OOH
Global DOOH expenditure rose to US$25.5bn USD in 2025, equivalent to 47% of all OOH revenues, and remains the principal driver of growth across the medium. DOOH is forecast to account for 49% of OOH spend in 2026, reaching US$28bn and poised to overtake static for the first time.
Investment in DOOH infrastructure varies considerably by region. APAC leads at 55.7% of OOH revenues, ahead of Europe at 41.3%, North America at 36.9%, LATAM at 27.7% and Africa at 18.0%.
Programmatic DOOH
Programmatically traded DOOH reached a reported US$2.1bn globally in 2025, representing 8.4% of total DOOH revenues. As this activity is not yet captured consistently across all markets, WOO have launched an independently audited survey of the leading global SSPs in partnership with PwC.
WOO president Tom Goddard says: “Any industry needs up to date, accurate numbers to compete and thanks to the diligent work of our Measurement Gurooh, Gideon Adey, we are now able to publish that for the entire global Out of Home industry. Thanks, of course, are also due to the many media owners, media agencies and OOH associations, who contribute generously and collaboratively to this herculean data collection project.
“We now have irrefutable evidence of a mature legacy medium making its way progressively in the digital age, enabling us to face whatever challenges the future will undoubtedly bring.”